Businesses have understood for some time now that the customer must be at the heart of their interests and that every product only exists to serve the customer. Clearly, marketing starts with the product. However, the path to creating a product is a long one, and presenting the product to its end consumer comes at the end of that path; it is decisive in the success of the project – if not the most decisive factor of all.
In the retail sector, people counting is an invaluable solution for analysing footfall and calculating the conversion rate. It is the first step in understanding the customer. The next step is to analyse what happens once the customer has entered your shop.
The retail sector differs from other sectors when it comes to the thought process before a purchase, and above all the decision to put a product in the basket and buy it. A product’s fate is decided in a shorter space of time in physical shops than online. You have probably heard the saying that “people don’t know what they want until they see it”. This is true, and two thirds of retail purchases are impulse buys, but that does not necessarily mean these impulse purchases are not based on ideas thought through beforehand. You need to look more closely to see what lies behind the impulse.
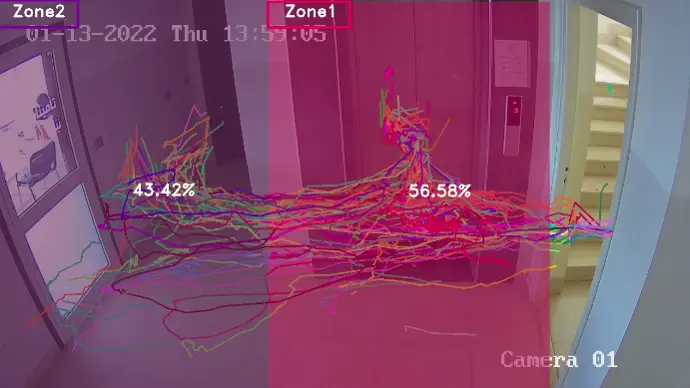
Heat map showing the percentages generated by different areas of the anavid headquarters.
Photo credits: anavid headquarters, Tunisia
The heat map gives you these details about your customers and guides you in optimising your retail marketing activities and boosting your sales. If you still don’t know the answers to the questions below, you are simply missing out on many opportunities
Do you know the busiest – and therefore most attractive – areas of your shops?
Does the appeal of these areas translate into sales?
Do your visitors spend enough time in your shop to become customers?
Follow your customers’ journey and change product placement, lighting and store layout to create the ideal journey. Guide your customers through your shop to give them the best possible experience and increase sales.
Discover the hot spots in your shop to find out your best-selling items.
All these actions are now possible thanks to the quantitative and qualitative studies that can be carried out with video analytics and/or Wi-Fi analytics.
By collecting meaningful dwell-time data, you can gain detailed insight into how attractive your new product range is and which products sell best when placed in different areas.
When you assess the level of customer interaction in each area of the shop, you can analyse the impact of your decisions on product placement, lighting and the positioning of shelves and mannequins.
With the heat map, you increase your sales by improving the aspects that encourage people to buy.
In other words, the heat map will help you improve your customers’ experience and thereby boost your performance.